Installing solar comes with some exciting changes around your home or business. You’ve got new panels on the roof, maybe a few new junction boxes on the side of the house, and probably a new smartphone app that tracks your system production. But what about your power bill?
As a new solar owner, you will start to see your solar savings roll in, but sometimes that bill can look complicated. Here are a few things to keep in mind when you receive your first power bill after your solar installation.
*Note: This example is based on a Florida Power and Light (FPL) bill and billing cycle. If you installed solar outside FPL territory, many of the same aspects apply. If you have questions, or need further assistance interpreting a non-FPL bill, please don’t hesitate to reach out to us at 850.472.0341 or contact your Energy Consultant.
Net Metering
When you go solar as an FPL customer, you’re enrolled in a billing mechanism called net metering. Through net metering, you gradually build up a bank of credits based on any excess energy you send back to the grid. During high consumption months, you draw from this bank of credits. At the end of the year, you receive compensation for any remaining credits up to a certain amount. When you first install solar, it’s normal to see a small power bill because you’re still building up that bank of credits.
System Design
Solar power systems are built to offset average consumption for the entire year – not just high consumption months. During periods of high energy usage, it’s normal to receive a power bill even with solar. High consumption periods usually occur in the summer and winter.
The images below have been taken from a real FPL customer bill. All identifying information has been removed. This customer has been generating energy with solar since 2019.

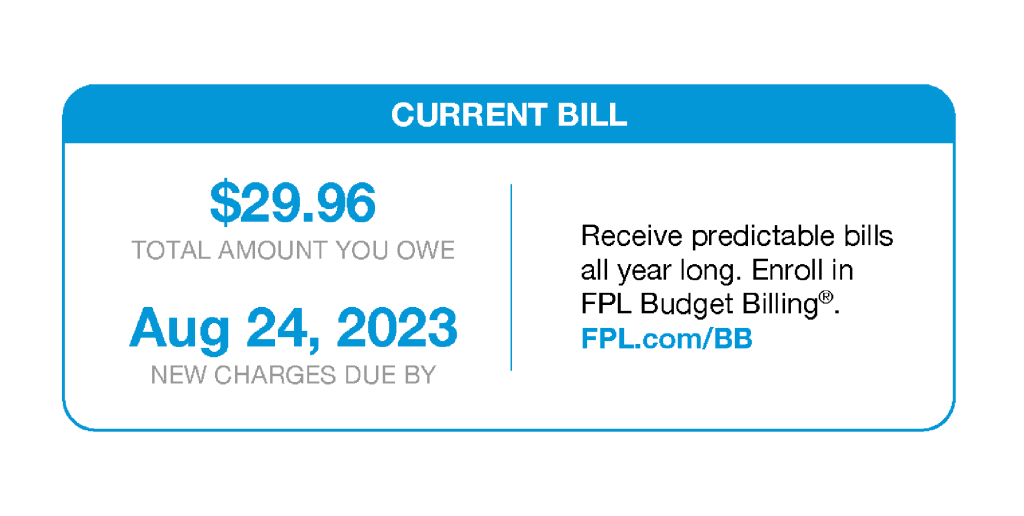
Current Bill
The Current Bill section will always show you how much you owe each month and when your bill is due. This section will remain unchanged from previous FPL bills you usually receive.
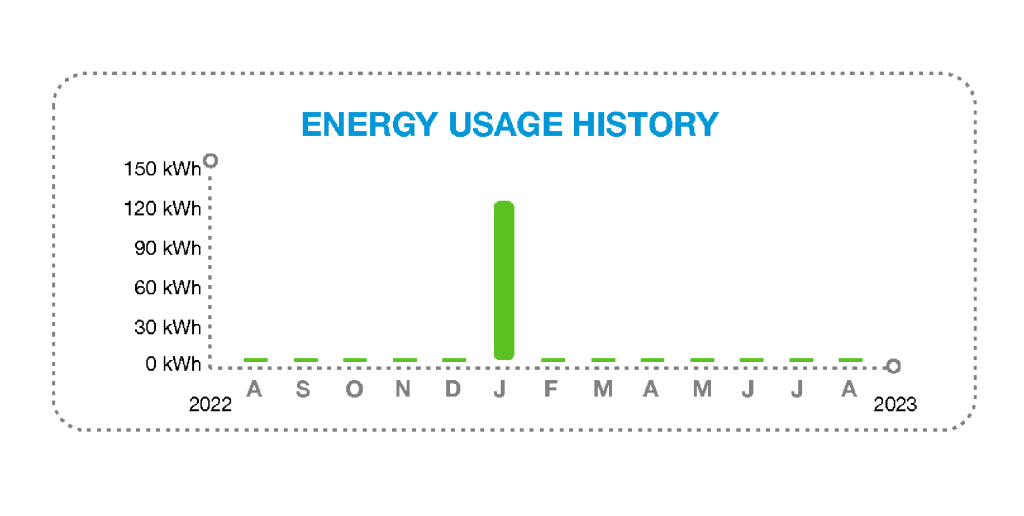
Energy Usage History
The energy usage history graph shows how many kilowatt-hours (kWh) you’ve purchased over a given period of time. Each month, the graph will compare the current billing period to the billing period from the previous year.
Our example bill is from July through August of 2023. Solar energy covered this customer’s energy usage for the entire year with the exception of January 2022.
Since you’ve just started generating energy with solar, your energy usage will probably look a little more consistent. You may even be able to see the exact month you installed solar based on a reduction in kWh purchased.
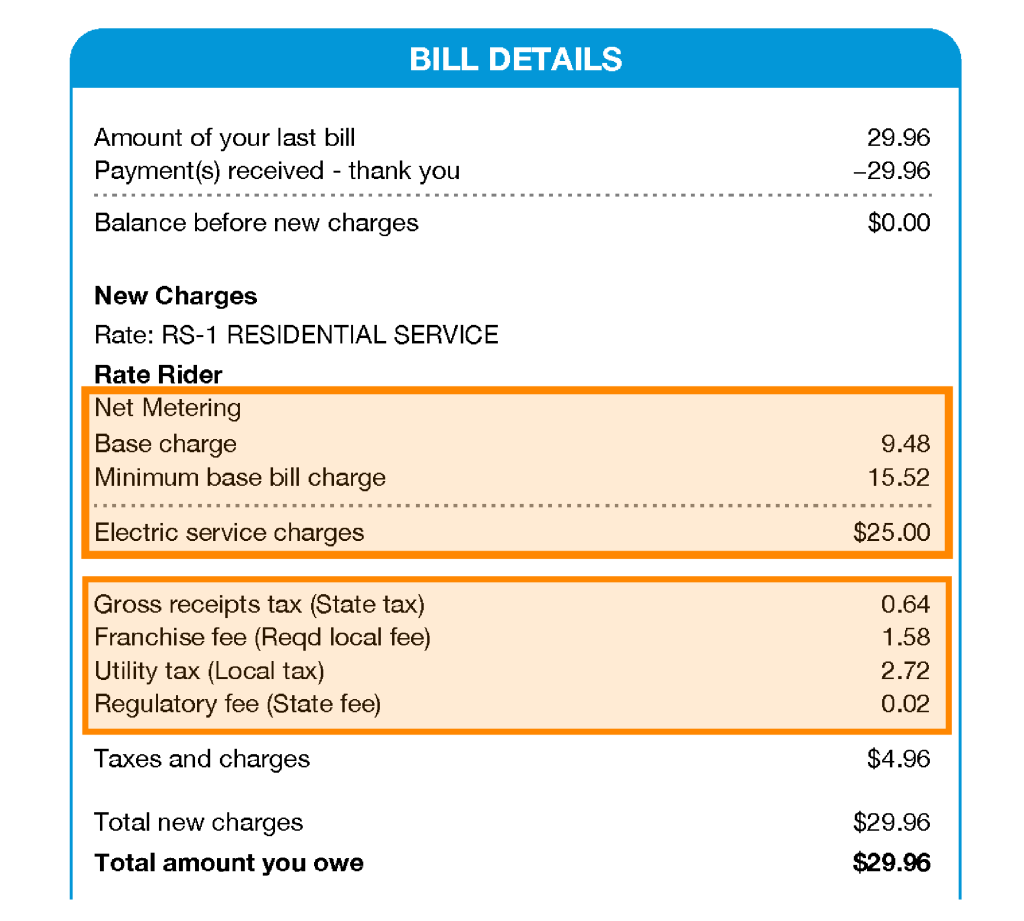
Bill Details: Base & Minimum Charges
All FPL customers are charged a base fee and a minimum bill fee. These are fixed charges that remain unchanged regardless of whether you use solar energy.
In our example, solar and net metering credits covered all of this customer’s energy use for the current billing period. This means that they only incur the fixed charge of $25 plus additional taxes and fees.
The net metering line will show how much FPL owes you based on what they have received from your solar power system. However, this payout only comes at the end of the year if you have a remaining credit bank.
Meter Summary
Your meter summary can sometimes look like the most complicated part of your power bill. However, it’s a great way to understand how much energy your solar power system is generating, and how much it’s offsetting your energy usage.
The meter summary details how much energy was delivered to the grid by your solar power system, and how much energy you received from the grid that wasn’t covered by solar. We’ll help break it down line by line.
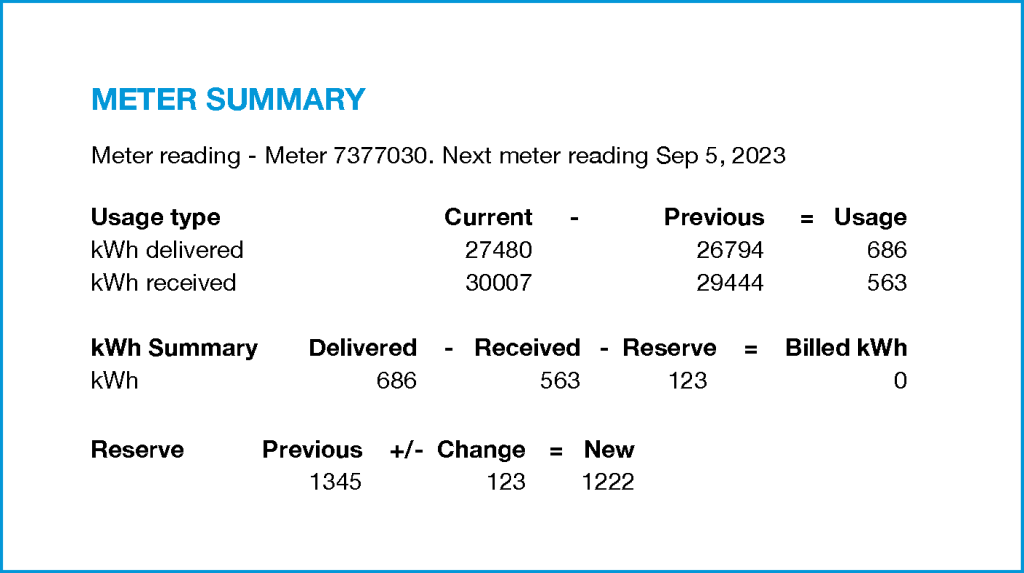
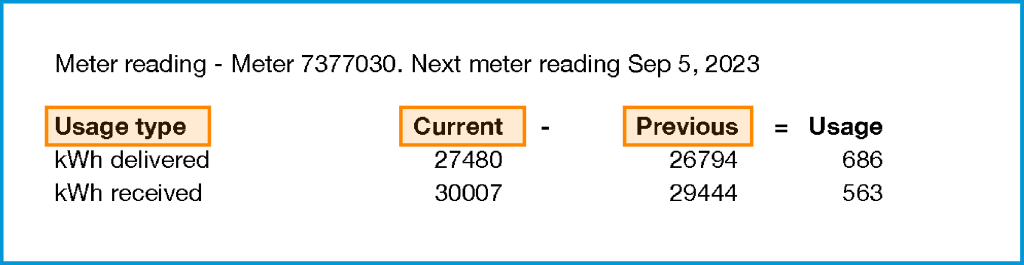
Meter Readings & Usage Type
When your meter is reprogrammed for bi-directional energy flow, the Usage type summary shows how much energy you have bought and sold during the lifetime of your system. The Current and Previous lines show your current and previous meter readings based on billing period. These numbers are then subtracted to determine how much energy was delivered and received.
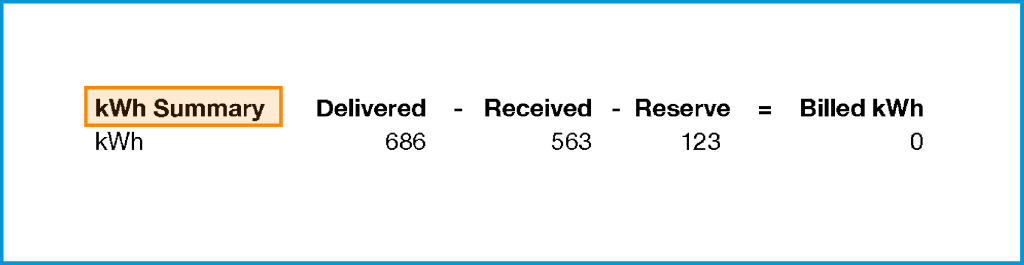
kWh Summary
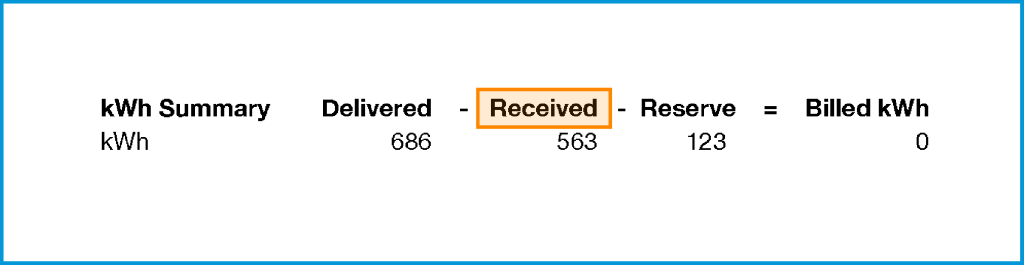
The kWh Summary shows how much energy was delivered and received. It shows the calculation for kWh usage that must be billed or taken from net metering reserve.
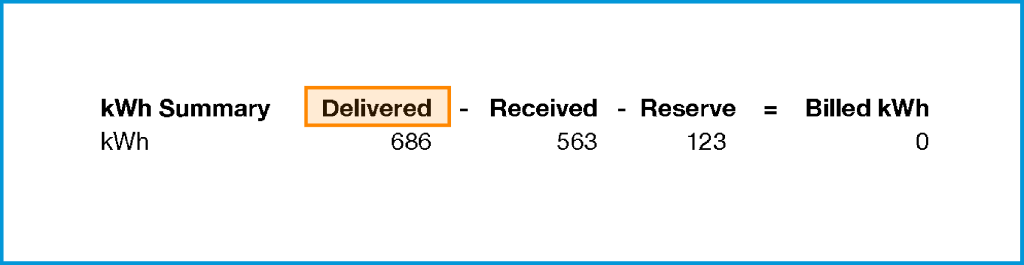
Delivered & Received
The Delivered line shows how much energy the grid delivered to your home. During this billing period, the customer used 686 kWh from the grid. Remember, it’s normal for a grid-tied solar power system to use energy from the grid.
The Received line shows how much energy was received by the grid from your solar power system. During this billing period, FPL received 563 kWh. Remember that you consume the energy generated by your system first before sending excess back to the grid.
In our example, this billing period shows that the customer used more kWh than what was received.
686 kWh delivered – 563 kWh received = 123 kWh purchased from FPL.
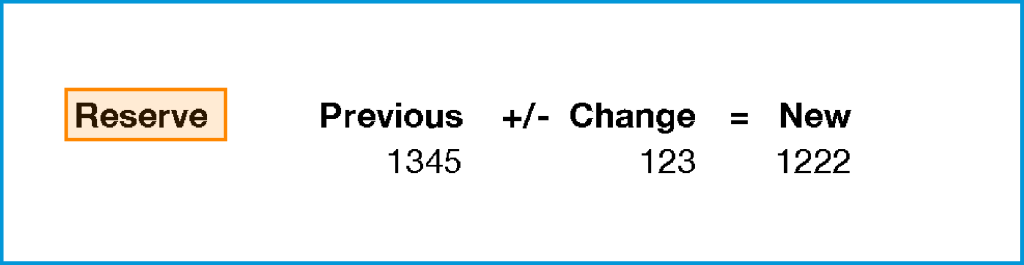
Reserve
With net metering, customers build up a bank of credits to use during months of high consumption. During this billing period, the customer used 123 kWh more than what was received by FPL. But because they have net metering credits, that 123 kWh comes out of their reserve bank and they do not receive any charges.
The Reserve section shows the overall net metering credit bank. For this customer, their previous reserve was at 1345 kWh before the 123 kWh was deducted during this billing cycle.
Questions or concerns about your latest bill? We’re here to help. Give us a call at 850-472-0341 or contact your Energy Consultant.